

Darren Price08/09/2026
11 min read
Live streaming entered 2026 bigger, more fragmented and more competitive than ever, with three platforms — Amazon’s Twitch, the Stake-backed challenger Kick and Google’s YouTube Gaming — defining the gaming-focused corner of the market. This reference page pulls together the most reliable 2025 full-year and early-2026 figures on viewership, market share, monetisation and top creators so journalists and analysts can cite them with confidence. Free to use with a link back to ShaneTheGamer as the source.
Key Takeaways for Journalists
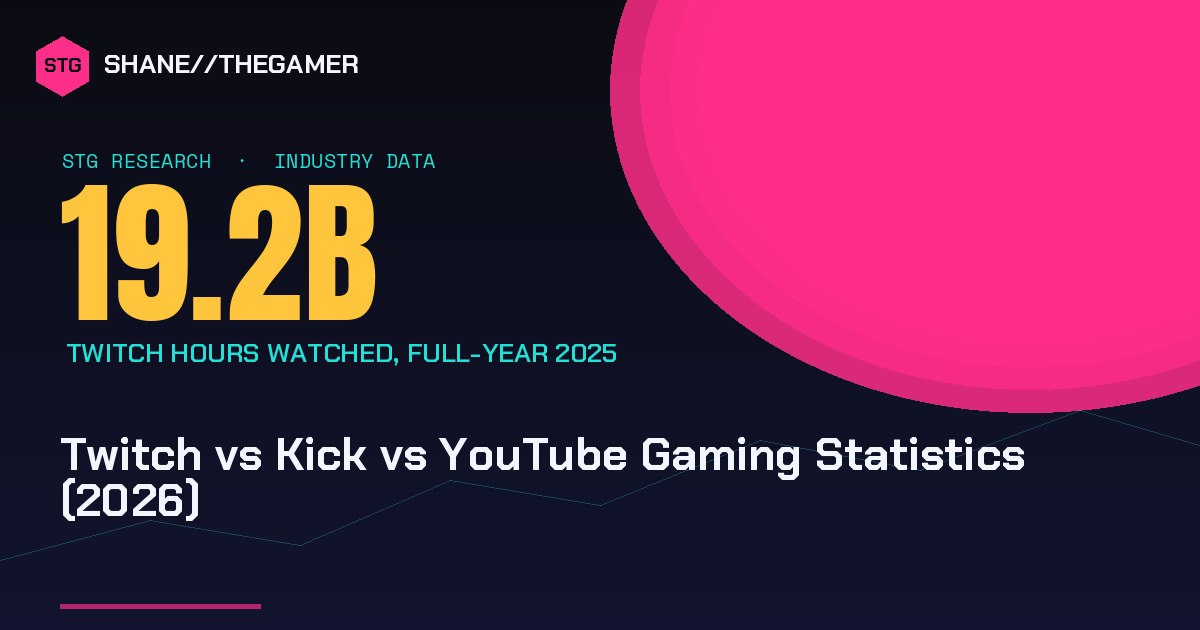
- 19.2 billion hours watched on Twitch in 2025 — it remained the most-watched gaming platform, but its viewership fell roughly 10% year-over-year.
- 8.8 billion hours on YouTube Gaming in 2025 — a record year for the platform, up around 12% annually per Stream Hatchet.
- 4.5 billion hours on Kick in 2025 — up 131%, the fastest growth of any major platform, per Stream Hatchet’s 2025 Yearly Report.
- 36.4 billion hours across all platforms in 2025 — a 6% annual gain that brought the industry close to its 2021 pandemic peak of 37.1 billion.
- Twitch dropped below 50% gaming market share for the first time — happening in Q3 2025 per Stream Hatchet, down from a 71% peak in Q3 2023.
- Kick keeps 95% of subscription revenue for creators — versus Twitch’s standard 50% split, a core driver of creator migration.
- ~$1.9 billion estimated Twitch revenue in 2025 — up about 5.6% from an estimated $1.8B in 2024 per resourcera/Business of Apps-style estimates.
- Kai Cenat was 2025’s most-watched streamer — 131.9 million hours and the first Twitch creator to hit 1 million active subscribers.
- Record 31.4 billion hours in Q2 2026 — the biggest quarter ever, lifted by the FIFA World Cup, with YouTube taking 49.5% share.
- Kick has narrowed the Twitch gap to ~3:1 — down from roughly 5:1 a year earlier by Q2 2026.
The 2026 Market at a Glance: YouTube Leads, Twitch Slips, Kick Surges
The single most important structural fact of 2026 is that no one platform dominates live streaming outright. Live streaming viewership reached 36.4 billion hours watched in 2025, a 6% year-over-year increase that brought the industry close to its 2021 pandemic-era peak of 37.1 billion hours, according to Stream Hatchet’s 2025 Live Streaming Trends Report. That headline growth, however, masks sharply diverging platform trajectories.
When all live content — gaming and non-gaming — is measured, YouTube is the clear overall leader. YouTube leads with roughly 47% of all hours watched, TikTok Live sits second with close to 30%, and Twitch is third at just over 15%, according to Streams Charts. But the gaming-specific picture is different: on gaming-focused watch time, Twitch remained the most-watched gaming platform with 19.2 billion hours in 2025, though its share fell 8.3 percentage points across the year, per Stream Hatchet’s 2025 Yearly Report.
Twitch’s decline was consistent and structural. The platform recorded three consecutive quarterly declines in viewership, and Q4’s 4.4 billion hours were the lowest since Q1 2020. A key catalyst was a policy change: Twitch ended its multi-stream ban in 2024, so most top creators now simulcast on YouTube, Kick, or both. That erosion of exclusivity, combined with viewbotting crackdowns, is central to any story on Twitch’s 2025 slide.
Gaming Market Share: Twitch Below 50% for the First Time
On gaming-specific hours watched, Twitch’s dominance has visibly cracked. Twitch dropped below 50% market share for the first time ever in Q3 2025, partially due to viewbotting crackdowns, but remained the most-viewed platform, per Stream Hatchet’s Q3 2025 report. That is a striking reversal for a platform once synonymous with game streaming.
The trajectory is best understood quarter by quarter. Twitch held 54% of the gaming live stream market share in Q2 2025, down from 71% in Q3 2023. In that same Q2 2025 window, YouTube Gaming captured 24%, and Kick took 11%. The competitive squeeze is coming from both a resurgent YouTube and a rapidly scaling Kick simultaneously.
The narrowing is dramatic when you look at raw ratios. The gap between Twitch and YouTube Gaming has narrowed from roughly 3:1 two years ago to just over 2:1 today. Against Kick, Twitch still produced about three times more hours watched by Q2 2026, but the gap is much smaller than a year ago, when it was closer to five times.
| Platform | Q2 2025 Gaming Hours Watched | Q2 2025 Gaming Market Share |
|---|---|---|
| Twitch | 4.9 billion | 54.2% |
| YouTube Gaming | 2.2 billion | 24.3% |
| Kick | ~1.1 billion | ~11% |
Kick’s Rise: The Fastest-Growing Major Platform
Kick was the defining growth story of the year. Kick recorded the fastest growth among major platforms, with hours watched rising 131% to 4.5 billion in 2025, securing approximately one-eighth of the total live streaming market, per Stream Hatchet. Its creator base scaled just as fast: the platform’s unique channel count grew 68% to 1.8 million.
Kick’s 2025 breakthrough moment came mid-year. In Q2 2025 Kick surpassed the “1 billion Hours Watched” threshold, generating over 1.1 billion hours (up 28.1% from Q1 2025), joining YouTube Live, TikTok Live and Twitch as the industry’s fourth major platform, per Streams Charts. The platform also set a headline concurrency record: 4,600,683 all-time peak concurrent viewers on October 19, 2025, per Streams Charts.
User scale is harder to pin down and should be quoted carefully. Multiple trackers citing Streams Charts data report Kick reached approximately 100 million total users by early 2026. Growth did show its first sign of cooling late in the year — Kick reached roughly 5 billion hours across the wider market, though Q4 2025 was its first-ever declining quarter, per Streams Charts figures cited by NeonStreamLab. Note the modest discrepancy between Stream Hatchet’s 4.5B gaming-focused figure and broader all-content totals; both are worth flagging in copy.
YouTube Gaming’s Record Year
YouTube Gaming quietly had its strongest year on record. YouTube Gaming reached a record 8.8 billion hours watched in 2025, per Stream Hatchet’s dedicated YouTube Gaming report. That represented a 12% annual gain, its best year ever.
The platform’s strength runs deeper than gaming alone, and that broader footprint matters for context. When all live categories are counted, YouTube Live logged 56 billion hours in 2025 (up 2% year-over-year, roughly 47% of the market), per Streams Charts and Esports Insider’s summary. That gap — 8.8 billion gaming hours inside a 56 billion-hour total — shows how much of YouTube’s live business is sports, music and entertainment rather than games.
Individual creator performance underlines YouTube Gaming’s pull. IShowSpeed led the platform with 68.5 million hours watched. Regionally, the platform is heavily weighted toward emerging markets: India, Vietnam, Indonesia and Thailand together added up to 472 million hours watched, reflecting high South Asian engagement.
One caveat for 2026 coverage: YouTube Gaming’s momentum is not linear. YouTube Gaming’s hours watched fell 12.4% in Q2 2026 compared with Q1, a decline the report attributes partly to esports broadcasts spreading across a wider range of platforms, per Streams Charts. This reflects regional esports rights shifting toward local services like SOOP and CHZZK rather than a collapse in demand.
Monetisation: Where the Revenue Splits Diverge
The clearest competitive differentiator between the three platforms is how much creators keep. Kick allows content creators to earn 95% of their subscription revenue, with the service taking only 5% — one of the lowest commission fees of any comparable platform — versus Twitch’s standard 50% split for non-partners, while YouTube creators share 30% of Super Chat and Super Stickers with Google.
Twitch does offer an incentivised tier. Twitch’s Partner Plus Program, launched in June 2023, allows streamers with at least 350 recurring paid subscribers for three consecutive months to earn 70% of their net subscription revenue. In practical dollar terms, on Twitch a $5 sub gives the streamer about $2.50, on Kick the streamer gets around $4.75, and Kick also allows streamers to keep 100% of tips with no fees on donations.
On platform-level revenue, always present Twitch’s numbers as estimates. Twitch generated an estimated $1.90 billion in revenue in 2025, up 5.6% from an estimated $1.80 billion in 2024, per re22 before declining to $1.8 billion in 2024. Because Twitch sits inside Amazon, its standalone economics are opaque, so treat every revenue and valuation figure as a modelled range rather than a reported result
At the top of the creator economy, the money has never been larger. Fifty creators earned a combined $1.02 billion between March 2025 and March 2026, the first billion-dollar total in the five years Forbes has published its Top Creators ranking. Platform subscription payouts, however, account for only a small slice of elite-creator earnings — sponsorships, merchandise and outside ventures dominate.
| Metric | Twitch | Kick | YouTube |
|---|---|---|---|
| Standard sub revenue share to creator | 50% (up to 70% Partner Plus) | 95% | 70% on Super Chat/Stickers |
| Tips / donations cut | Third-party dependent | 0% (creator keeps 100%) | 30% on Super Chat |
| Est. 2025 platform revenue | ~$1.9B (estimated) | Not disclosed | Part of Google (not broken out) |
Top Creators and Defining Moments
The creator layer tells the platform story in miniature. Kai Cenat was the most-watched individual streamer of the year with 131.9 million total hours, during which he became the first Twitch creator to reach 1 million active subscribers. His marathon broadcast was the year’s signature event — during Mafiathon 3 he surpassed 1 million concurrent viewers on Twitch and set a new all-time subscriber record.
Esports co-streaming reshaped how competitive content is consumed. Co-streaming accounted for 50% of all esports viewership, totaling 1.4 billion hours, with Caedrel recording 83 million hours as the top co-streamer. For deeper competitive figures, see our esports earnings research. Overall esports viewership also hit a high: esports viewership reached record highs in 2025, increasing 6% year over year to 2.8 billion hours watched, per Stream Hatchet.
Creator-led live events drove some of the year’s biggest peaks. Spanish streamer Ibai’s La Velada del Año V drew 9.2 million peak concurrent viewers on Twitch, the highest of any creator-led event in 2025. Migration also continued to bite Twitch: viewership from Twitch’s top creators fell 14.5% year-over-year, with streamers Baiano and Gaules transitioning to YouTube Gaming and Kick.
Non-gaming content is now central to all three platforms. Non-gaming content such as Just Chatting (25%) and IRL (19%) continued to grow, making up 22% of Twitch viewership in 2025. This structural drift from game-centric streaming toward talk and IRL formats is one of the most citable trends for a 2026 feature.
Where 2026 Is Heading
Early 2026 data confirms both continued market growth and continued fragmentation. The platforms Streams Charts tracks generated more than 31.43 billion hours watched in Q2 2026 — 8% higher than the previous quarter and the biggest quarterly total the industry has recorded. The driver was overwhelmingly sports: the FIFA World Cup 2026 generated over 2.4 billion hours watched across livestreaming platforms, with YouTube accounting for over 94.8% of that total.
That sports surge lifted YouTube specifically. YouTube passed 15.5 billion hours watched in Q2 2026, up 14.8% from Q1, accounting for 49.5% of all livestreaming hours watched. Twitch, meanwhile, held steady but did not benefit: Twitch changed little, staying within a 1% range of Q1.
Twitch’s Q2 2026 highlight came from gaming, not sports. June gave Twitch its best Peak Viewers result in 11 months, when Summer Game Fest 2026 broadcasts pushed the platform past 4.4 million concurrent viewers. Kick, for its part, grew its total hours watched by 7.6% quarter over quarter in Q2 2026. For broader market context, see our gaming industry statistics.
Frequently Asked Questions
Which platform had the most hours watched in 2025?
For gaming content, Twitch led with 19.2 billion hours watched in 2025 per Stream Hatchet, ahead of YouTube Gaming (8.8 billion) and Kick (4.5 billion). Across all live content, YouTube is the overall leader with roughly 47% of hours watched.
Is Kick really bigger than Twitch now?
No. Kick grew 131% to 4.5 billion gaming hours in 2025, but Twitch still produced roughly three times Kick’s hours watched by Q2 2026, down from about five times a year earlier.
How much of subscription revenue do creators keep on each platform?
Kick gives creators 95% of subscription revenue, Twitch gives 50% (up to 70% under Partner Plus), and YouTube shares 70% of Super Chat and Super Stickers income.
Who was the most-watched streamer in 2025?
Kai Cenat, with 131.9 million total hours watched, becoming the first Twitch creator to reach 1 million active subscribers during his Mafiathon 3 marathon.
How big is the live streaming market in 2026?
Q2 2026 set a record 31.4 billion hours watched across all tracked platforms per Streams Charts, an 8% quarter-over-quarter increase driven largely by the FIFA World Cup.
Methodology & Sourcing
Figures on this page were compiled from third-party analytics providers that monitor public live-streaming data — primarily Stream Hatchet (a GameSquare subsidiary), Streams Charts, TwitchTracker and Statista — supplemented by trade press summaries from Esports Insider, Net Influencer and GamesHub. Because Twitch, Kick and YouTube do not publish standardised, audited viewership or revenue data, most figures are third-party estimates and different providers use different methodologies, tracking windows and platform definitions (for example, “gaming hours” versus all-content hours), which explains apparent discrepancies such as Kick’s 4.5 billion gaming figure versus higher all-content totals. All revenue and valuation figures for Twitch are modelled estimates and should be treated as ranges, not reported results. Projections and approximate values are labelled “estimated,” “projected” or “~”. Where sources conflict, we have favoured the most recent primary report and flagged the variance in the text.
Sources
- Stream Hatchet — 2025 Yearly Live Streaming Trends Report; YouTube Gaming 2025 Report; Q2/Q3/Q4 2025 Reports (2025-2026)
- Streams Charts — Q2 2025, Q4 2025, Q1 2026 and Q2 2026 Global Livestreaming Landscape reports; FIFA World Cup 2026 recap (2025-2026)
- Statista — live streaming platform share and creator revenue-share data (2025)
- Esports Insider — Stream Hatchet Q2 2025 coverage (2025)
- Net Influencer — Q2 2025, 2025 annual and Q2 2026 livestreaming coverage (2025-2026)
- GamesHub — Stream Hatchet Q2 2025 report coverage (2025)
- resourcera / Business of Apps — Twitch revenue estimates (2025-2026)
- Forbes — Top Creators ranking, March 2025-March 2026 (2026)
- OneStream / NeonStreamLab — Kick vs Twitch monetisation and market-share summaries (2025-2026)
Spotted a newer figure or an error? Contact the ShaneTheGamer desk and we will update this page.
